This experiment was “documented” in a Youtube video.
Introduction
What happens when a 6.5 mil trace gets 1A of current? Does it explode? What about 2A? 3A? In this video I pushed two identical boards passed the breaking point to find out where that breaking point is.
Hypothesis
The theory, as shown in Saturn PCB Design Toolkit is that 2oz copper will give a bump in the amount of heat the board can expel, but there is a point of diminishing return. 10x the copper weight is certainly not 10x the power handling.
2oz copper comes with added financial costs and requires greater track spacing and clearance.
It is expected that the 2oz copper will have greater thermal capacity, but the improvement may not be as much as intuitively expected.
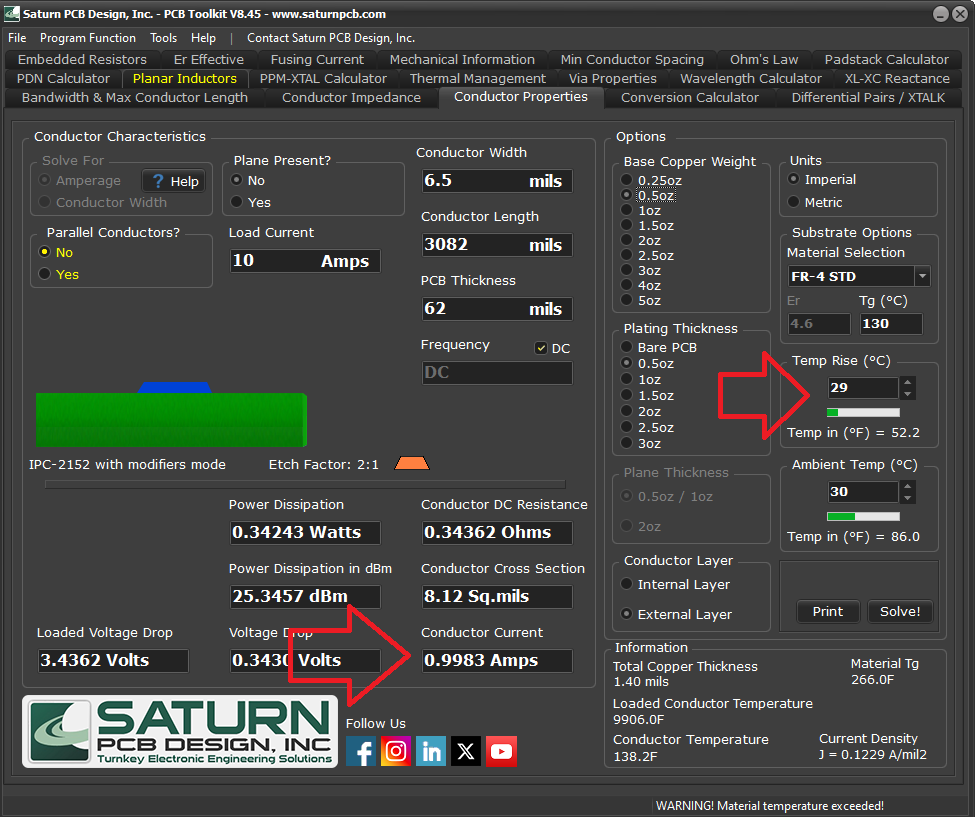
Above, we can see a predicted rise of 29C when 1A is applied to the 6.5mil trace for this 1oz board.
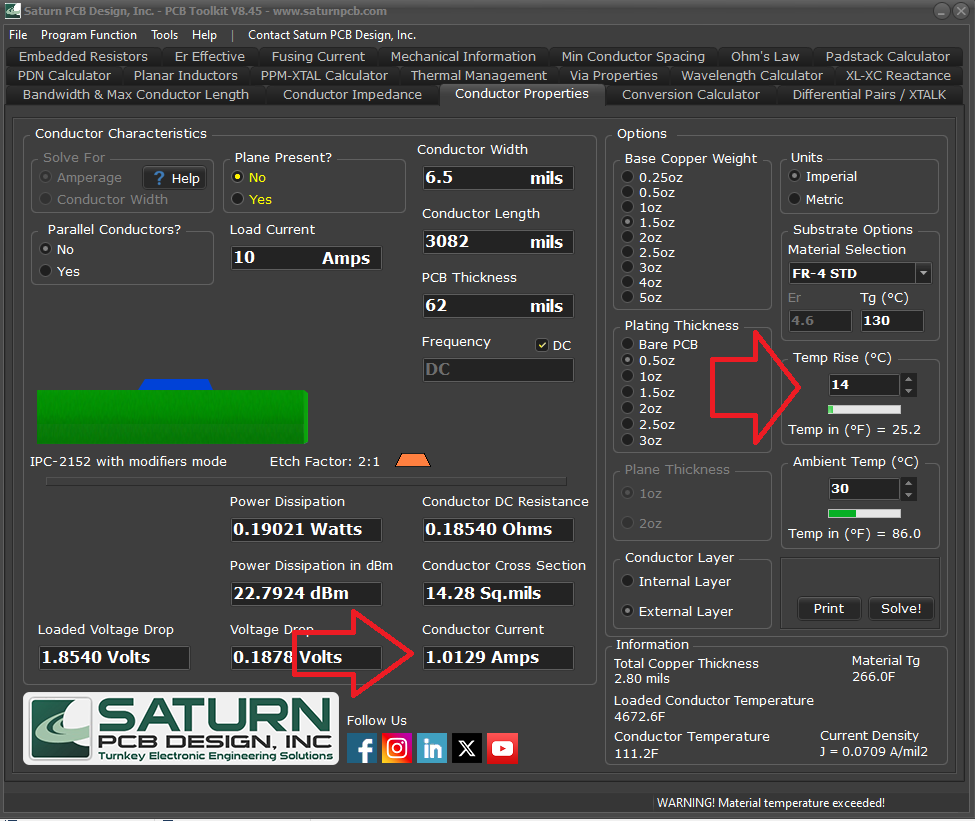
The 2oz board is expected to rise 14C when 1A is applied.

With 2A applied to the 1oz board, the expected rise in temperature is 142C.
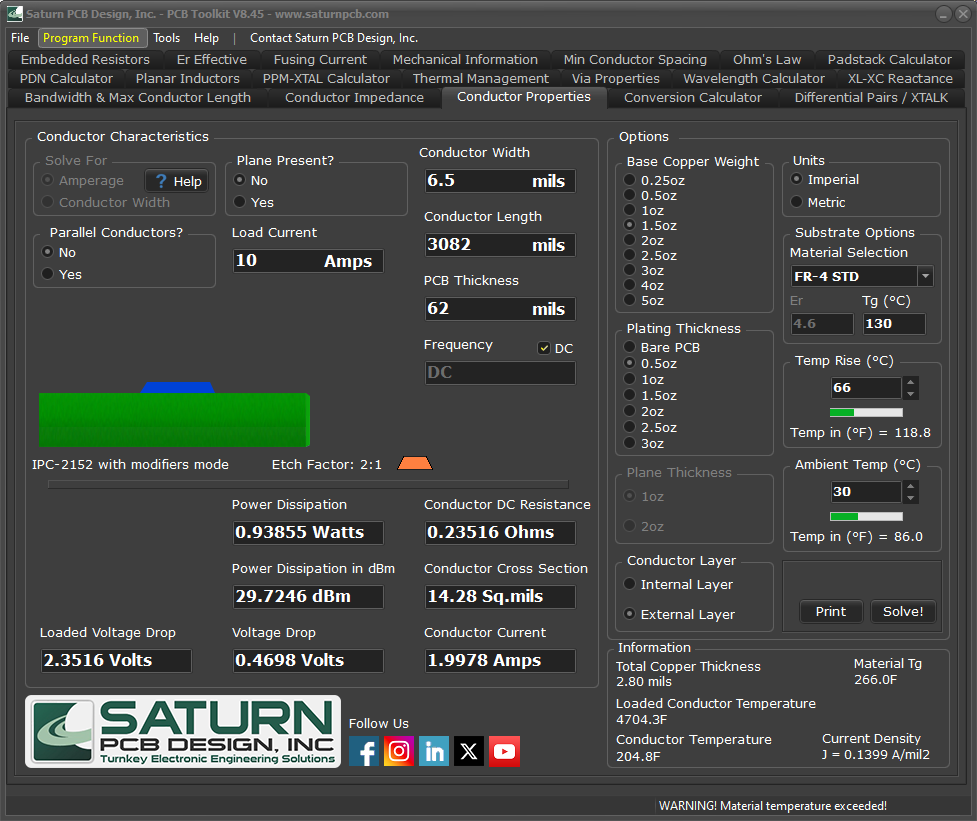
With 2A applied to the 2oz board, the expected temperature rise is 66C.
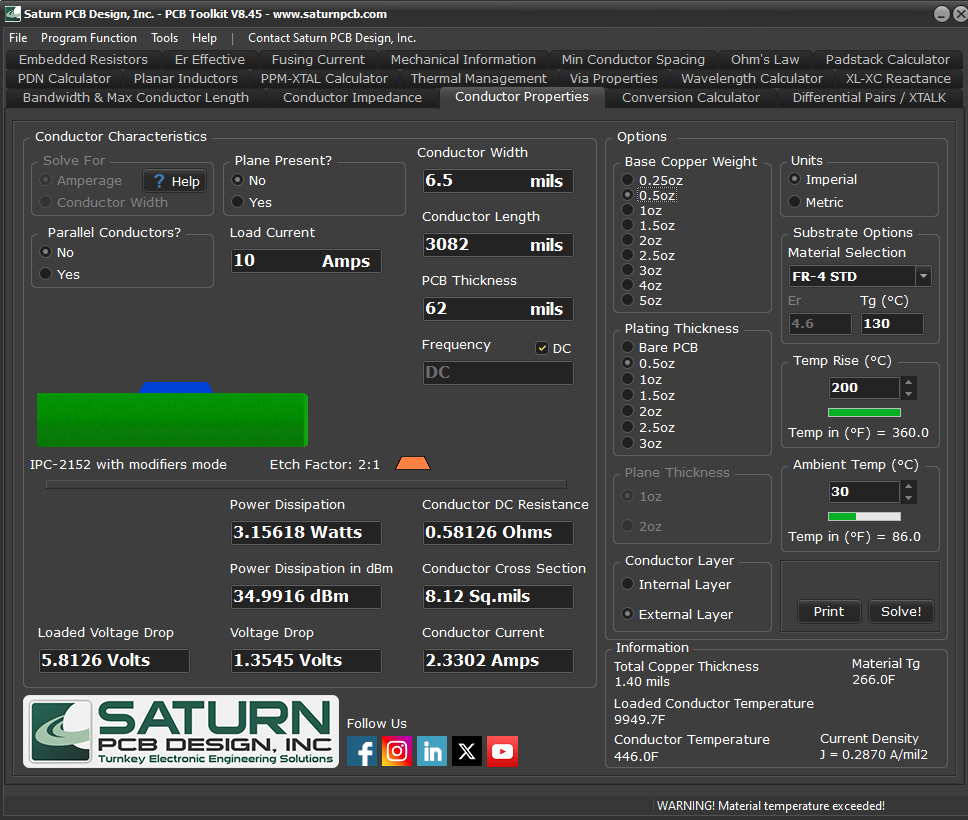
Pushing Saturn PCB Design Toolkit to its limits, a 1oz trace a 200C temperature rise will occur at 2.33A.
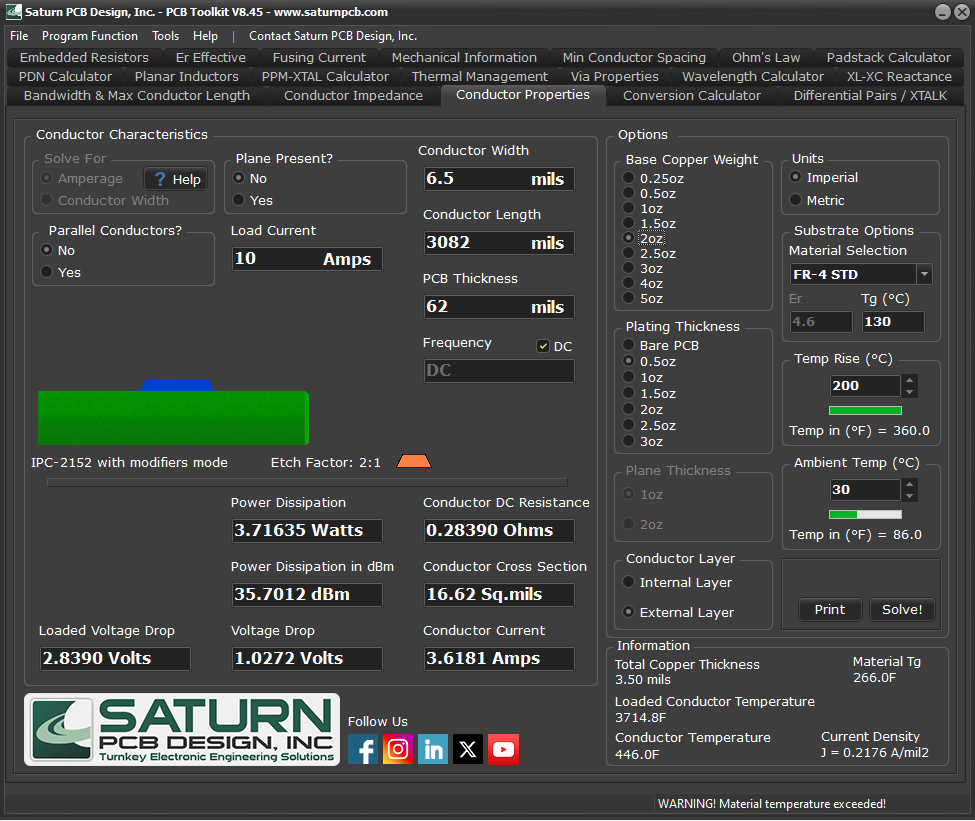
The 2oz board is predicted to hit the 200C rise in temperature with 3.62A.
Saturn PCB Toolkit shows that the 1oz board will hit its “wall” much sooner than the 2oz board. When 2A is applied, the thermal characteristics of the of the 2oz PCB are much better than 1oz. However, when increasing the current up to 3.6A, the 2oz board faces meltdown….according to Saturn PCB Toolkit.
Experiment
Two identical 62 mil / 1.62mm FR4, TG-135 PCBs.
- One 3 inch trace. The trace width for both PCBs is 6.5mils, which is the minimum trace width for 2oz copper.
- The 1oz PCB uses 1oz (35um) finished, which means that JLC started with something approximating 0.5oz as the base copper and added an additional 0.5oz to plate up the finished 1oz value.
- The 2oz PCB uses a finished 2oz, which means it started with something approximating 1.5oz and was plated up to 2oz finished.
- Run constant current through board until temperature flattens out for 1 minute in the following increments: 1A, 2A, 3A, 4A, and 4.5A.
- The soldermask was sanded from the 3mil trace to expose the copper for the purpose of combustion.
- Placed thermocouple about 1mm from the exposed copper trace.
Equipment
Thermocouple: https://amzn.to/4bWcSC4
This thermocouple meter allows logging the data to software in the PC. The software is a little basic but gets the job done. The hardware performed flawlessly. It’s intuitive to set offsets to ensure the thermocouples at least read ambient temperature identically.
Power Supplies https://amzn.to/4wbf8Nc
I purchased two of these for these experiments. I’ve pushed 300W for extended periods of time in hot, humid, and sunny conditions. No problems. They aren’t the most convenient tools to use as I have to unplug the banana plugs before changing settings, but otherwise, they’ve been flawless. For the money they can’t be beat.
Data
Download the zipped CSV files.
Results
1A Test
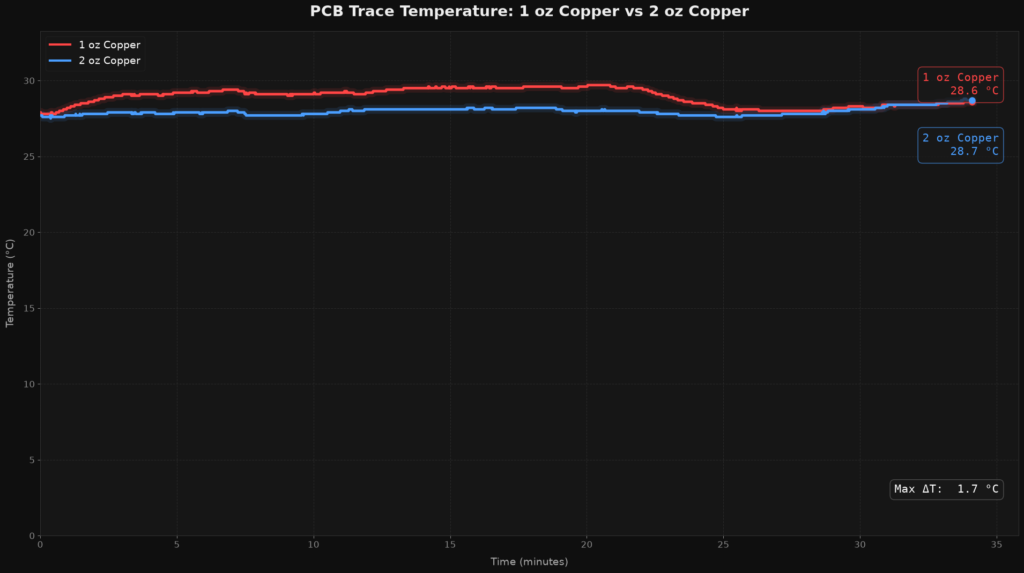
With 1A being pumped to both a 1oz board and a 2oz board, the temperature increase was nearly zero. The 1oz board was just 1.7C hotter than the2oz board, which did not seem to increase at temperature at all.
2A

At 2A, the 2oz board did rise slightly. Just a few degrees. The 1oz board rose to a value 7.7C hotter than the 2oz board. I wonder if a 1oz board could handle 2A for an entire day? I suspect so. Not sure about a year.
3A
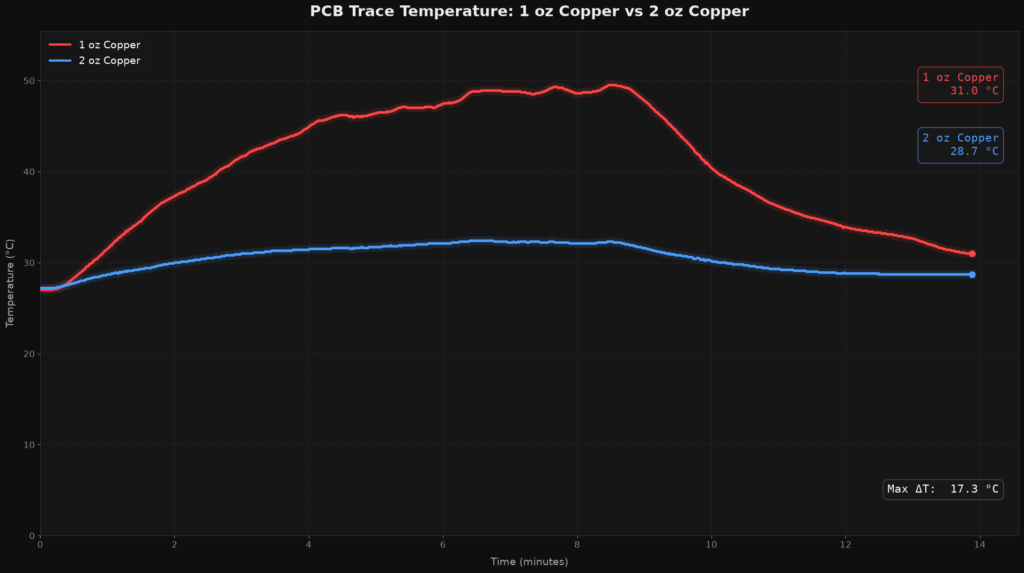
The 2oz board board rose ~3C over ambient. The 1oz board rose an additional 17.3C.
4A
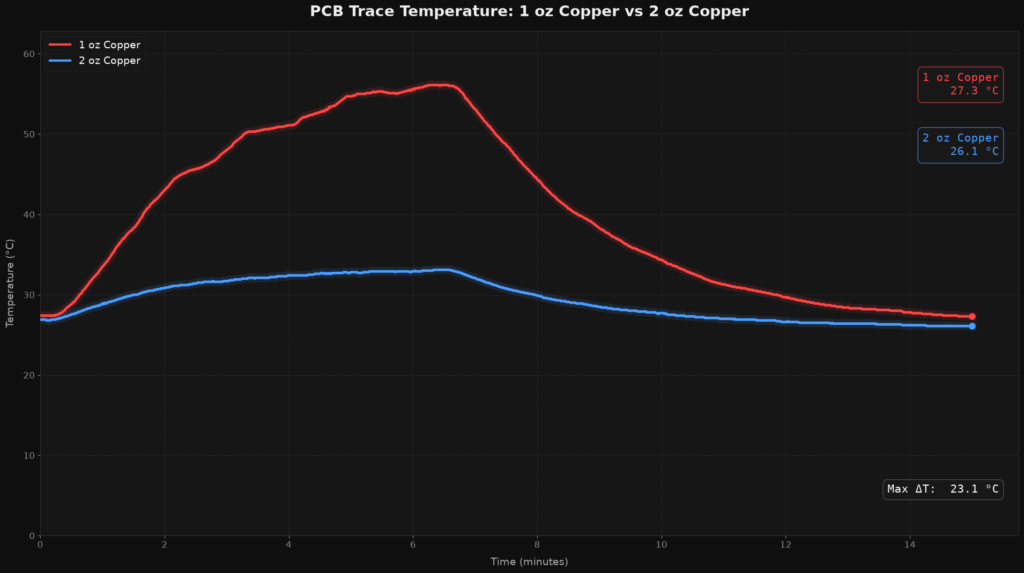
With 4A, the 1oz board shot up quickly. Within 2 minutes, it was 17C over ambient. The 2oz was decidedly more resilient. The boards peaked at about 7 minutes in with the 1oz copper being 23.1C warmer than the 2oz board.
5A
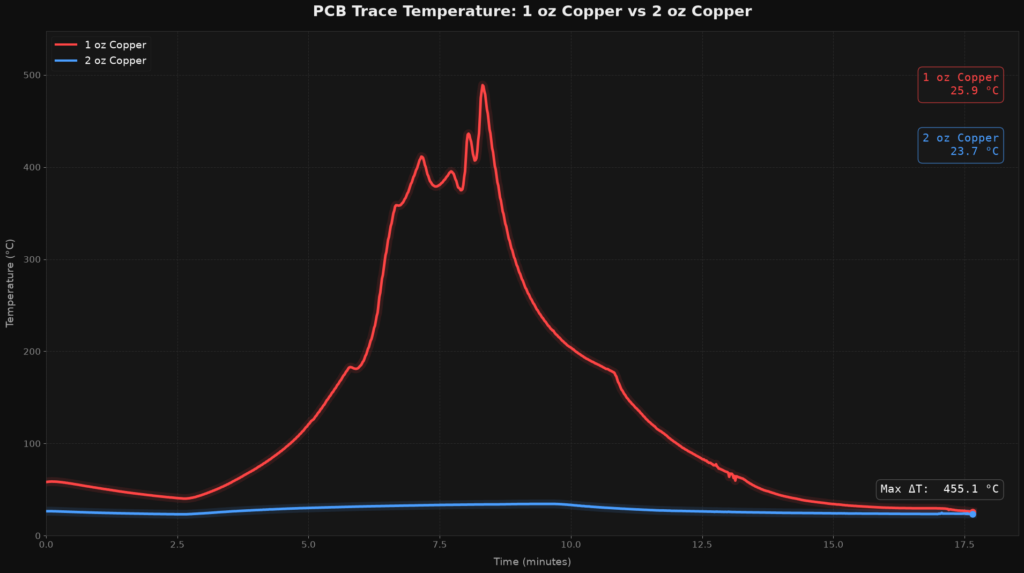
With 4.5A applied, the 1oz copper leaped from 41.5C to 182C ( the estimated point of ignition ) in about 3 minutes. As interesting as the graph is, a large contributor of the temperature increase was certainly caused by the ignited cotton.
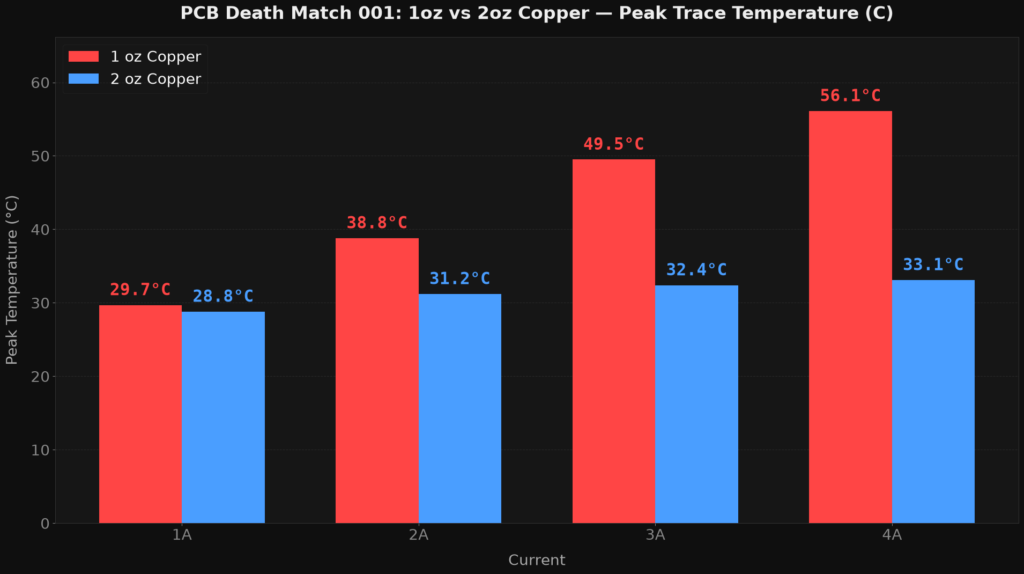
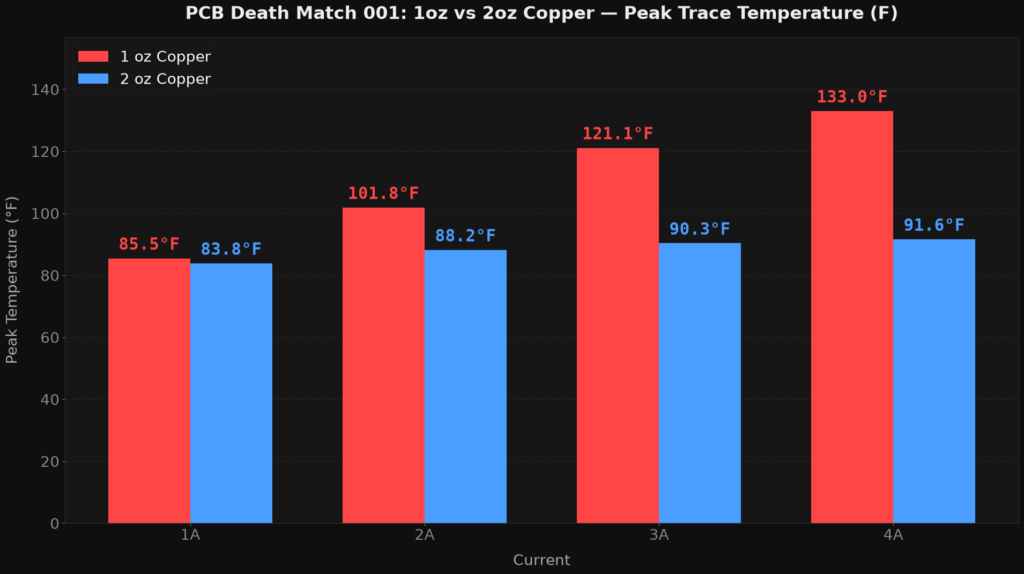
The above graphs show the maximum peak temperatures of 1oz vs 2oz at 4 different current levels. The linear increase in the 1oz board is certainly interesting.
Conclusion
It’s clear that my DIY measurement method is not comparable to what Saturn PCB Toolkit provides. Most likely, Saturn PCB Toolkit measures the temperature of the trace and not the FR4. Obviously, these are very different thing.
It’s clear that copper traces, even with no copper planes or vias to dissipate heat are capable of handling much larger amounts of current than I have previous thought. This test was SUPPOSED to catch on fire, which is a very different situation than PCBs that we may not want to catch on fire. However, it’s clear that a 6.5mil trace doesn’t immediately explode when it receives 3A or even 4A.